
Instant visibility into where data comes from, how it transforms, and where it is used across the entire stack, all without accessing the data itself.


Dashboards show results, not origins. When numbers shift unexpectedly, teams feel the impact long before they find the cause.
This dashboard shows two point five million, but where does that number come from? Manual tracing through systems and stale documentation slows everything down.
Metrics change without explanation and confidence drops. Decision makers hesitate and teams lose alignment.
New hires spend weeks gathering tribal knowledge instead of delivering insights.
Teams need a reliable method to understand upstream and downstream effects for every code change. This starts where work happens inside the pull request. Each change is analyzed automatically, revealing exactly which models, tables, columns, and dashboards depend on the update. Engineers see the impact instantly, fix issues early, and merge with confidence.
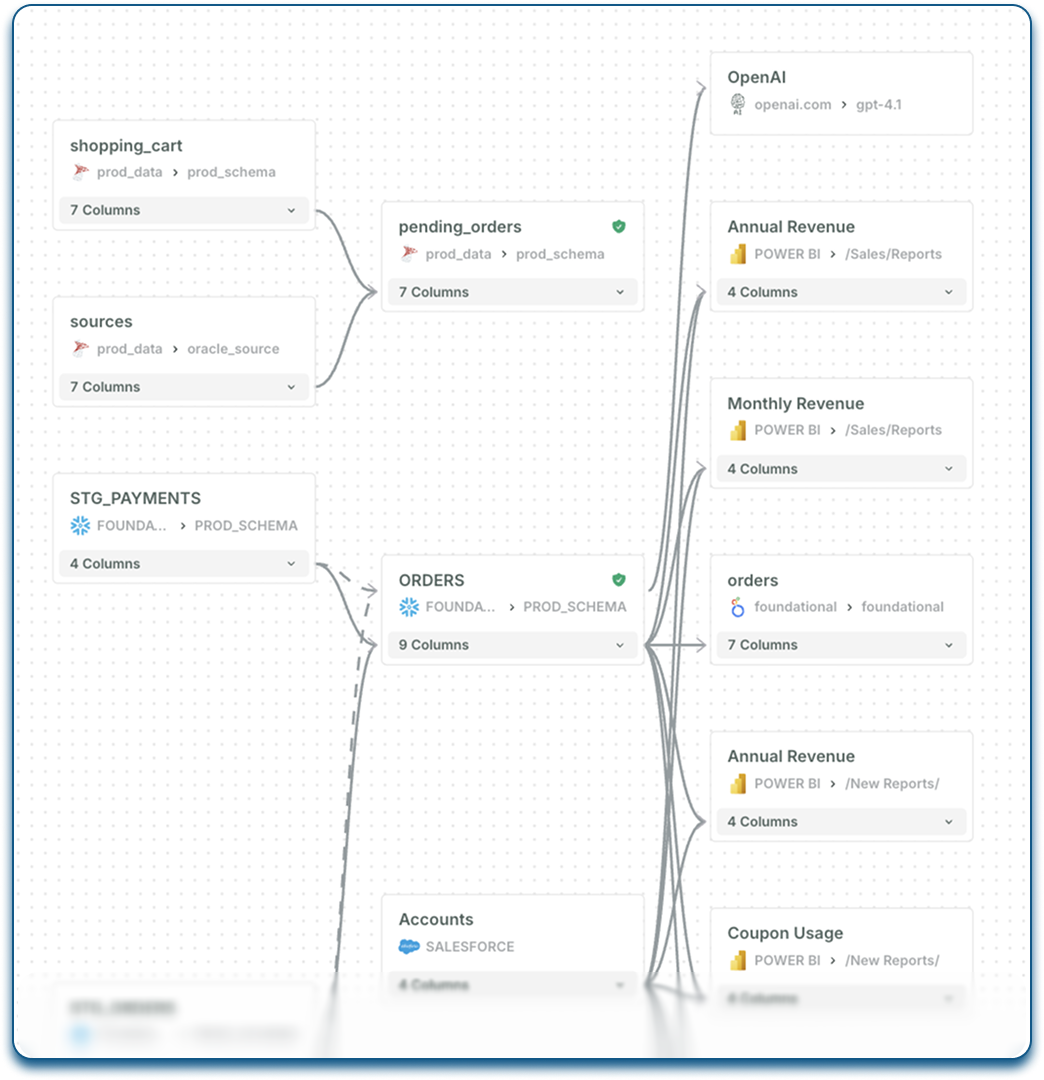
Gain transparency into data flows and dependencies that power analytics, operations, and AI.
Understanding data flows is only useful when teams can act on that insight quickly.
Search any table, column, or dashboard and see its full lineage across systems in seconds.
Click through flows, drill into transformations, and understand logic at each step.
Trace a metric back through its transformations to pinpoint changes quickly. Five minutes instead of five hours.
Lineage updates automatically with every commit. No manual upkeep. No stale documentation.
Teams find the right tables, dashboards, and owners instantly.
Executives and analysts rely on consistent, transparent lineage. Metrics stay aligned and decisions stay confident.
Engineering, analytics, and governance teams share a unified view of data movement and dependencies.
Teams trace issues to their source in minutes, not hours.

